Streamline Your Operations: Manufacturing Process Flow Charts
Ever wondered how a product comes to life from a mere idea? The secret lies in the manufacturing process flow chart, a roadmap that guides the journey of raw materials into finished goods. It’s a fascinating world where efficiency meets innovation, and I’m excited to delve into it with you.
Understanding the manufacturing process flow chart is akin to learning a new language. It’s a visual representation of a product’s life cycle, from conception to delivery. This tool is crucial for manufacturers, ensuring a smooth, efficient production line.
Understanding Manufacturing Process Flow Charts
Flow charts speak volumes in the manufacturing sector. Much like music notes are to a symphony, these graphical representations harmonize the production process, translating the intricate rhythm of manufacturing into a language anyone can comprehend.
The Role of Flow Charts in Manufacturing
When manufacturing a product, flow charts act as the soul of seamless coordination. I liken them to a well-orchestrated dance, dictating the steps for each production component. These charts serve as a concierge, guiding raw materials through each phase of production. By visually outlining the path from start to finish, they encourage efficiency, enhance quality, and minimize waste. For instance, a beverage company may use a flow chart to illustrate the process of turning water, barley, hops, and yeast into a finely crafted beer.
Key Components of a Manufacturing Flow Chart
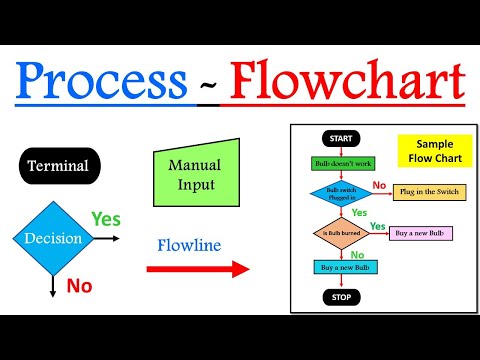
The essence of a manufacturing flow chart lies in its components. They’re the active players that drive the production narrative. Several elements come together to form such a flow chart – process stages, decisions, and flows.
- Process stages are the events of the story. Each one signifies an action or task within the production process. In a cookie production line, these might include mixing, baking, cooling, and packaging.
- Decisions, shown as diamond-shaped boxes, represent checkpoints. These are points where a yes or no verdict influences the subsequent direction of the process. For instance, a quality control checkpoint might dictate whether the cookies are fit for packaging or deemed unfit and rerouted.
- Flows illustrate the movement from one stage to the next. They’re the arrows that connect the stages and decisions, guiding the eye – much like a conductor directs the orchestra.
By deciphering the language of manufacturing as portrayed in a process flow chart, one unlocks the secret to streamlined, efficient production.
Types of Manufacturing Process Flow Charts

In the realm of production, one encounters diverse types of manufacturing process flow charts. These charts, similar to navigational tools in the sea of production, help steer the course of manufacturing actions. Let’s examine three principal types: Block Diagrams, Swimlane Flowcharts, and Value Stream Mapping.
Block Diagrams
A Block Diagram plots the manufacturing pathway in a simplified manner. It’s a high-level visual representation of the production process. Here, the focus lies in presenting the sequence without immersing into intricate details. For instance, a bakery’s block diagram may illustrate the process as: “Dough preparation, Baking, Cooling, Packaging, Dispatch”. The primary purpose of Block Diagrams is to provide a straight overview, making them the go-to choice for initial project presentations and discussions.
Swimlane Flowcharts
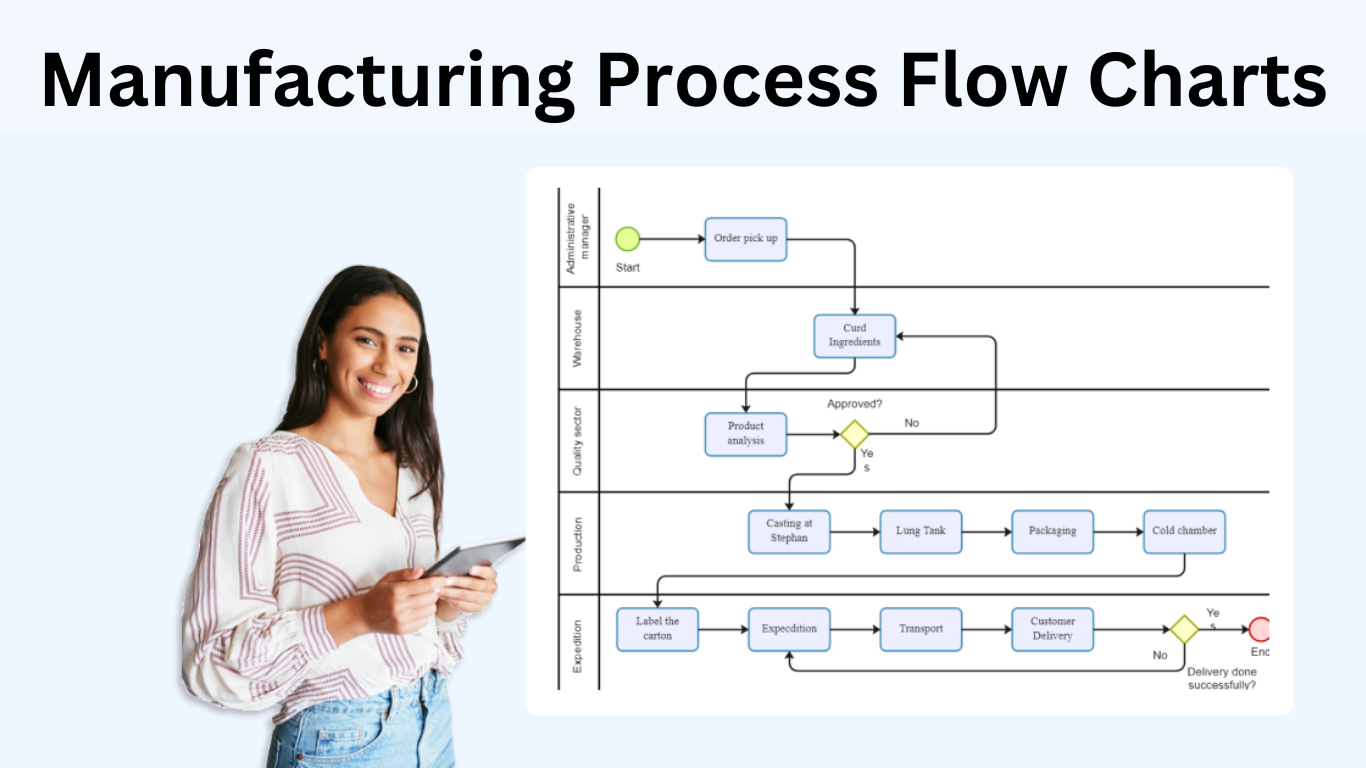
Taking a step deeper into the manufacturing ocean, Swimlane Flowcharts come into play. These charts segregate tasks based on who’s responsible, reminding a bird’s eye view of a swimming pool, where each lane belongs to a different swimmer. For example, in a car assembly line, tasks are divided between different stations: Frame Construction, Engine Installation, Interior Setup, Quality Check, etc. Each of these stations represent a ‘swimlane’. These diagrams excel in scenarios where clarity over division of tasks is essential.
Value Stream Mapping
The most detailed view comes from Value Stream Mapping. These charts portray production process along with associated data, like time taken per task or raw materials used. They’re the blueprints for a detailed operational strategy. Consider a furniture factory: beyond simple cutting and assembling wood, Value Stream Maps display details like time spent on cutting each piece, volume of wood used for various furniture items, or the delay caused due to drying process. For any enterprise aiming to optimize their process, Value Stream Mapping turns out to be a treasure trove of information.
Steps to Create a Manufacturing Process Flow Chart
Creating a flow chart for your manufacturing process requires careful thought, attention to detail, and a clear understanding of your production cycle. Let’s dive deeper into the process by considering three crucial steps: Identifying the Process Boundaries, Outlining the Steps and Sequences, and Including Decision Points and Inputs/Outputs.
Identifying the Process Boundaries
First off, we have to identify the process boundaries. The boundaries of a manufacturing process flow chart are the start and the endpoint. Start by defining the scope of the process you aim to chart. Consider the entire production cycle from receiving raw materials to the shipment of the finished product. Determine the beginning and end parameters of your manufacturing process to establish clear boundaries.
Outline the Steps and Sequences
Following the identification of process boundaries, let’s detail the crucial steps and sequences. Each step involved in the manufacturing process needs to be listed meticulously. Start at the beginning of your process and work your way to the end. List each step as it occurs, ensuring to include all processes, even those that might seem minor. For instance, in brewing beer, such steps might range from sourcing ingredients to performing quality checks on the final product.
Include Decision Points and Inputs/Outputs
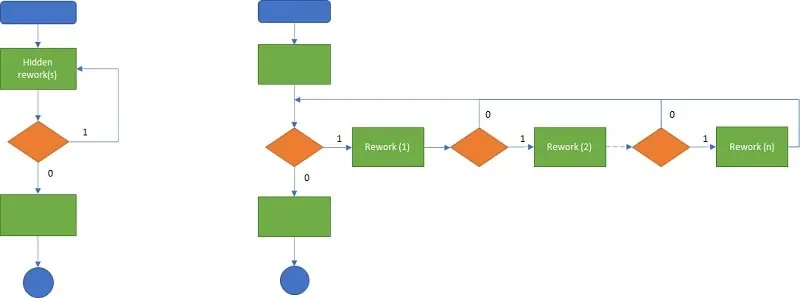
Lastly, we can’t overlook the importance of decision points and inputs/outputs. A manufacturing process flow chart should logically illustrate inputs and outputs at each step, as well as highlight crucial decision points. An example of an input could be raw materials, while an output might be a semi-finished product. Similarly, decision points typically direct the flow of the process. For instance, if a product fails a quality control check, the decision point might direct it back through the production line for rework.
By considering these three steps, a comprehensive manufacturing process flow chart can be realized, providing valuable insights and ensuring smooth, predictable production functions.
Benefits of Using Flow Charts in Manufacturing

Process improvement isn’t an abstract concept, but a tangible goal. With solid planning and implementation of strategies, it’s achievable. Commencing with flow charts in a manufacturing setting brings a wide array of advantages, which we’ll cover in this segment:
Improved Process Understanding
First on our list, flow charts boost the grasp of proceedings in the manufacturing cycle. By mapping out all tasks, sequences, inputs, and outputs distinctly, these diagrams offer a simplified view of often complex operations. Concrete clarity tends to replace ambiguity, and this aids stakeholders immensely. Let’s say, for example, an organization is assembling a bicycle. With clear cut documentation via the Flow Chart, an understanding of how the handlebars, wheels, and frame come together increases.
Enhanced Communication Across Teams
Akin to a universal language, flow charts unify communication within the organization. Stakeholders, ranging from top management to production staff, can refer to these diagrams for guide. They encapsulate the manufacturing process in a visual format that’s easily understandable. Think of a multinational firm: employees varying in cultural origins and native tongues can interpret a flow chart effortlessly, fostering a cohesive understanding of processes across different teams.
Efficient Training of New Employees
Thirdly, flow charts serve as robust supporting tools in inducting recruits into your manufacturing fold. New personnel gains quicker understanding when a pictorial rendition of the process journey is available, as opposed to voluminous, textual process manuscripts. With specific context, consider a newbie learning to operate a Printing Press. Whether a color separation stage or the printing stage, following the flow chart expedites comprehension!
Identifying Bottlenecks and Opportunities for Improvement
Lastly, flow charts benchmark the process flow, which can be analyzed for potential refinements and improvements. Diagramming the manufacturing process reveals where the delays are. For instance, a chocolate making factory may discover that the glazing process is a consistent hold-up. Equipped with such insight, strategic efforts can center around streamlining this bottleneck, enhancing overall productivity. It’s a brace for a proactive, rather than reactive, approach. Simultaneously, improvement opportunities unearth themselves – an extra layer of coating might improve the product attractiveness, justifying an extra step in the process flow.
Together, these advantages tip the scale favoring the usage of flow charts. Not merely a blueprint, it’s an essential tool accelerating manufacturing performance, providing an edge in today’s competitive marketplace.
Best Practices for Implementing Manufacturing Flow Charts

The effective implementation of manufacturing flow charts rides on several best practices. These practices ensure flow charts serve as integral tools for the overall headway of any manufacturing organization.
Keeping It Simple
It’s essential to hold simplicity at the core of manufacturing flow charts. Complex charts may create confusion instead of clarity. For instance, flow charts with too many symbols or jargon-loaded terms can end up alienating team members. Instead, adopting universally understood symbols, such as rectangles for process steps and diamonds for decisions, provides clarity. De-cluttering, keeping the design clean, and using straight-forward language can all contribute to a comprehensible flow chart.
Regular Updates and Revisions
Manufacturing processes aren’t static; improvements and changes occur regularly. Hence, revising and updating manufacturing flow charts is a crucial practice that can’t be overlooked. For example, a manufacturing entity may decide to automate specific tasks or reassign responsibilities, which impacts the flow of operations. Keeping flow charts current with these changes ensures their continual relevance as a communication and coordination tool.
Using Software Tools for Flow Chart Creation
Gone are the days of hand-drawn flow charts. Today, a plethora of software tools exist that accelerate flow chart creation, make revisions hassle-free, and offer a host of pre-designed templates. These tools, such as Microsoft Visio and Lucidchart, offer automated features for creating and editing flow charts. Their features allow for easy adjustments, incorporation of new processes, and sharing of flow charts across different teams within the organization, propelling efficiency all through the manufacturing pipeline.
Case Studies: Successful Applications of Manufacturing Flow Charts

Manufacturing flow charts serve as comprehensive tools that encapsulate the entirety of a production process. Various industries, ranging from automotive to electronics, rely on these flow charts to maintain efficient operations. Below, I present two tier-one examples showcasing the effectiveness of using this practical tool.
Example in Automotive Industry
The automotive industry, often considered a benchmark in manufacturing, optimizes processes through the successful use of flow charts. Toyota, a renowned automotive manufacturer, leverages a specific type of flow chart known as the ‘Value Stream Map’ to chart their entire production process.
This detailed process map exhibits Toyota’s manufacturing steps from supplier to customer, filling the chart with vital information such as inventory and lead times at each node. With such an organized framework, Toyota identifies inefficiencies swiftly, spurred by the visibility of these charts. This enhances the company’s decision-making capabilities, leading to superior operational performance. The chart, interwoven with Toyota’s ‘Just-in-time’ philosophy, enables the automotive giant to maintain minimal inventory while preventing potential production stops due to shortages.
Example in Electronics Manufacturing
Electronics manufacturing yields high-complexity products and involves multiple intricate production processes. Flow charts prove instrumental in managing this complexity. Applying this to a real-world scenario, let’s consider Apple Inc’s production.
Apple leverages ‘Swimlane Flowcharts to chronologically organize production processes spanning multiple departments. Each department, or ‘swim lane,’ garners a clear view of their specific tasks and their sequence within the overall production workflow.
By tracking the flow of raw materials to the creation of finished products, bottlenecks become glaringly evident and easier to resolve. By employing such flow charts, Apple fosters seamless interconnectivity between departments, allowing for a shared vision and ultimately resulting in efficient production paths.
The application of manufacturing process flow charts, as illustrated by the automotive and electronics industries, serves as a testament to their crucial role in supercharging efficiency and effectiveness within high-complexity manufacturing landscapes.
Conclusion
I’ve walked you through the world of manufacturing process flow charts – their importance, types, creation, and benefits. We’ve seen how they’re the unsung heroes of the manufacturing industry, orchestrating operations like a maestro conducts a symphony. From Toyota’s Value Stream Maps to Apple’s Swimlane Flowcharts, these tools are instrumental in identifying bottlenecks, managing complexity, and boosting efficiency. They’re not just diagrams; they’re strategic assets that can transform the way a company operates. So, whether you’re in the automotive or electronics industry or any other sector, it’s time to tune into the music of manufacturing process flow charts. Let them guide your production towards a symphony of success.
Frequently Asked Question (Faqs)
What are manufacturing process flow charts?
Manufacturing process flow charts are visual representations like graphical diagrams that showcase the sequence of a process within a manufacturing setting. They assist in understanding the complete process and highlight any possible bottlenecks or areas where improvements can be made.
What are the different types of flow charts?
There are several types of flow charts used in the manufacturing industry, including Block Diagrams, which represent a process using blocks, and Swimlane Flowcharts, which segregate processes based on the department or function responsible.
How do flow charts benefit manufacturing processes?
Flow charts improve understanding and communication about the process, assist in training new employees, and identify bottlenecks or inefficiencies in the manufacturing process, hence increasing overall organizational efficiency and effectiveness.
What are some successful applications of flow charts in the manufacturing industry?
Toyota, in the automotive sector, successfully uses Value Stream Maps, a type of flow chart to quickly identify inefficiencies and improve operational performance. Also, in the electronics manufacturing industry, Apple uses Swimlane Flowcharts to manage complexity and boost production efficiency.
What is the process to create a flow chart?
Creating a flow chart involves identifying and understanding the process, defining the start and end points, detailing each step in the process in sequence, deciding on the type of flow chart to be used, and finally, reviewing and improving upon the first draft.
Leave a Reply