
Streamline Workflows with RACI Chart Templates
Navigating through project management can feel like walking through a maze. It’s easy to lose track of who’s doing what, and when. Enter the RACI chart template, your secret weapon to streamline responsibilities and keep your project on track.
A RACI chart—standing for Responsible, Accountable, Consulted, and Informed—isn’t just a fancy acronym. It’s a tool that can transform your project management process, clarifying roles and eliminating confusion. But how do you create one, and more importantly, how can you make it work for you?
In this article, I’ll be your guide, taking you through the ins and outs of a RACI chart template. We’ll explore its benefits, how to create one, and tips for effective utilization. So buckle up, and let’s turn that project management maze into a straight path to success.
Understanding the RACI Chart Templates
Delving deeper into the RACI Chart, I’ll reveal its intricate workings and how it upgrades project management mechanisms. This section eliminates ambiguity while inculcating a comprehensive understanding of a RACI Chart.
What Is a RACI Chart?
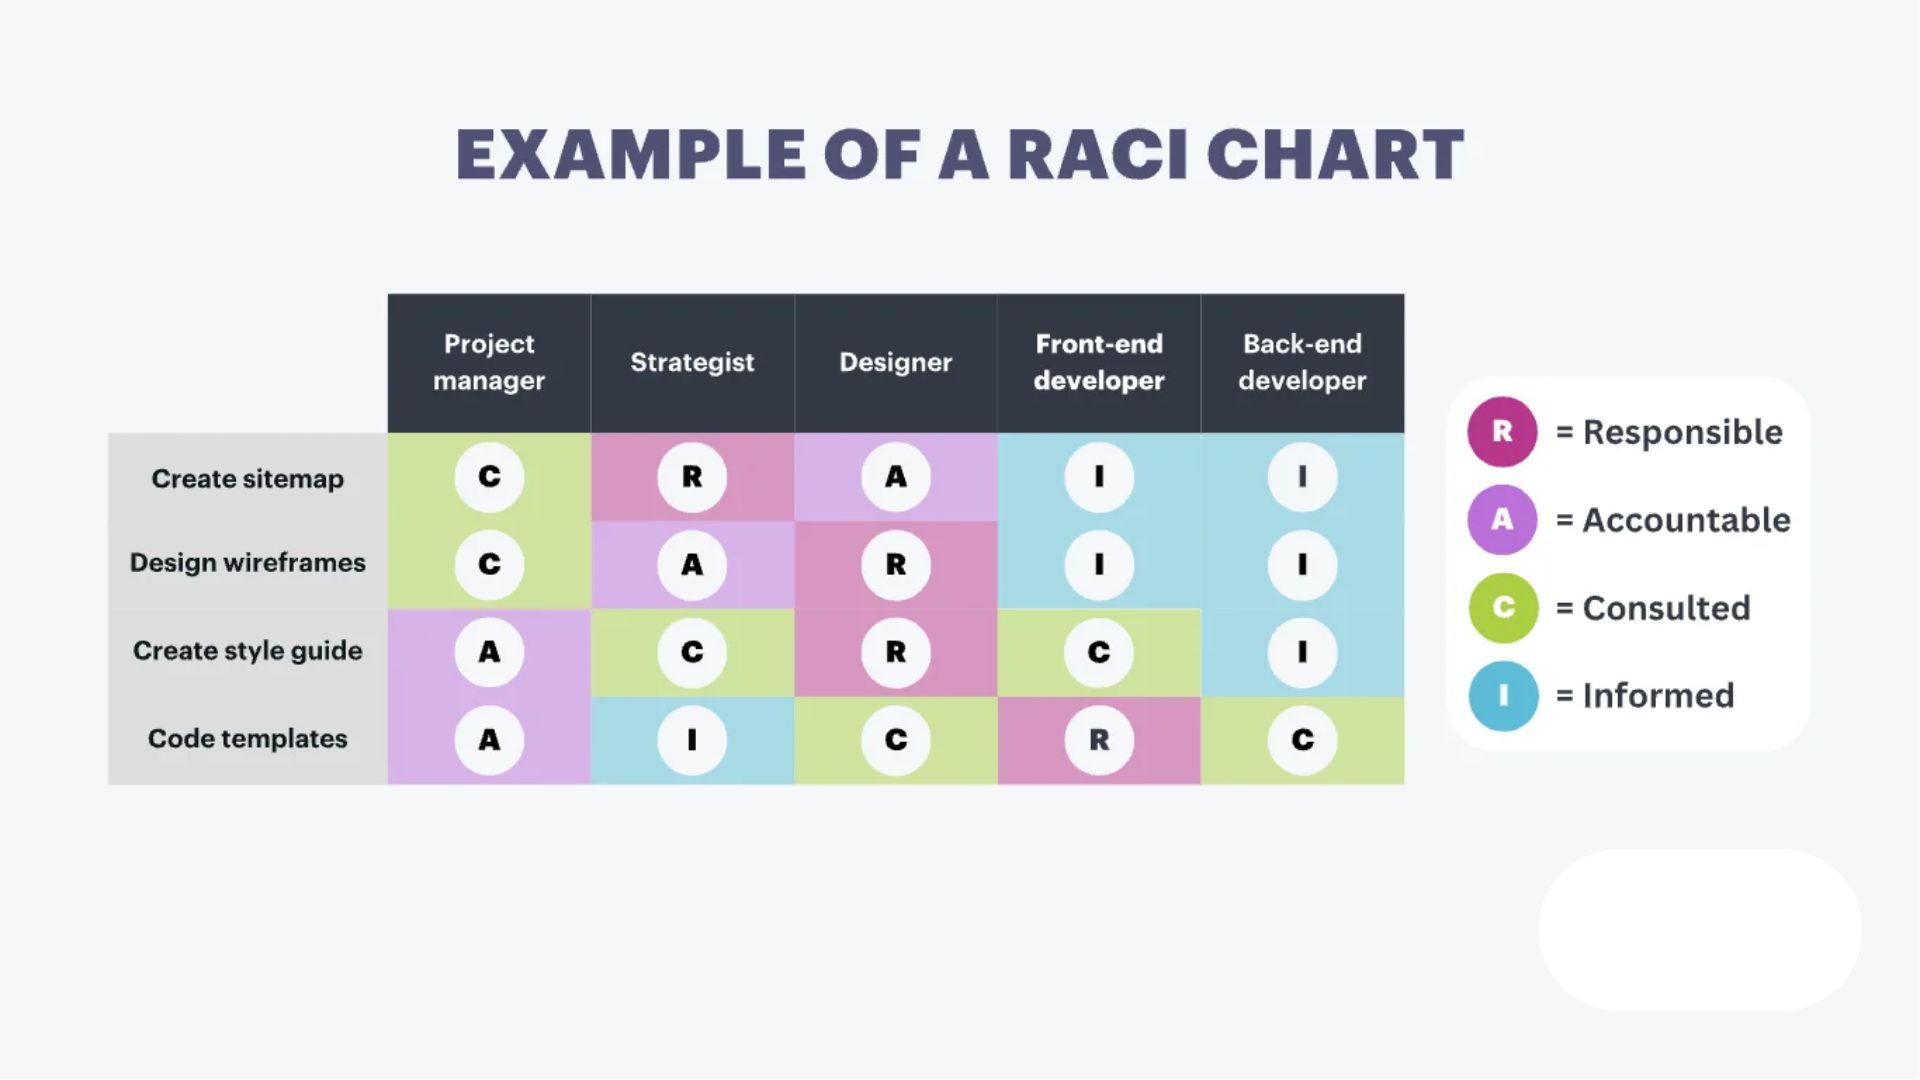
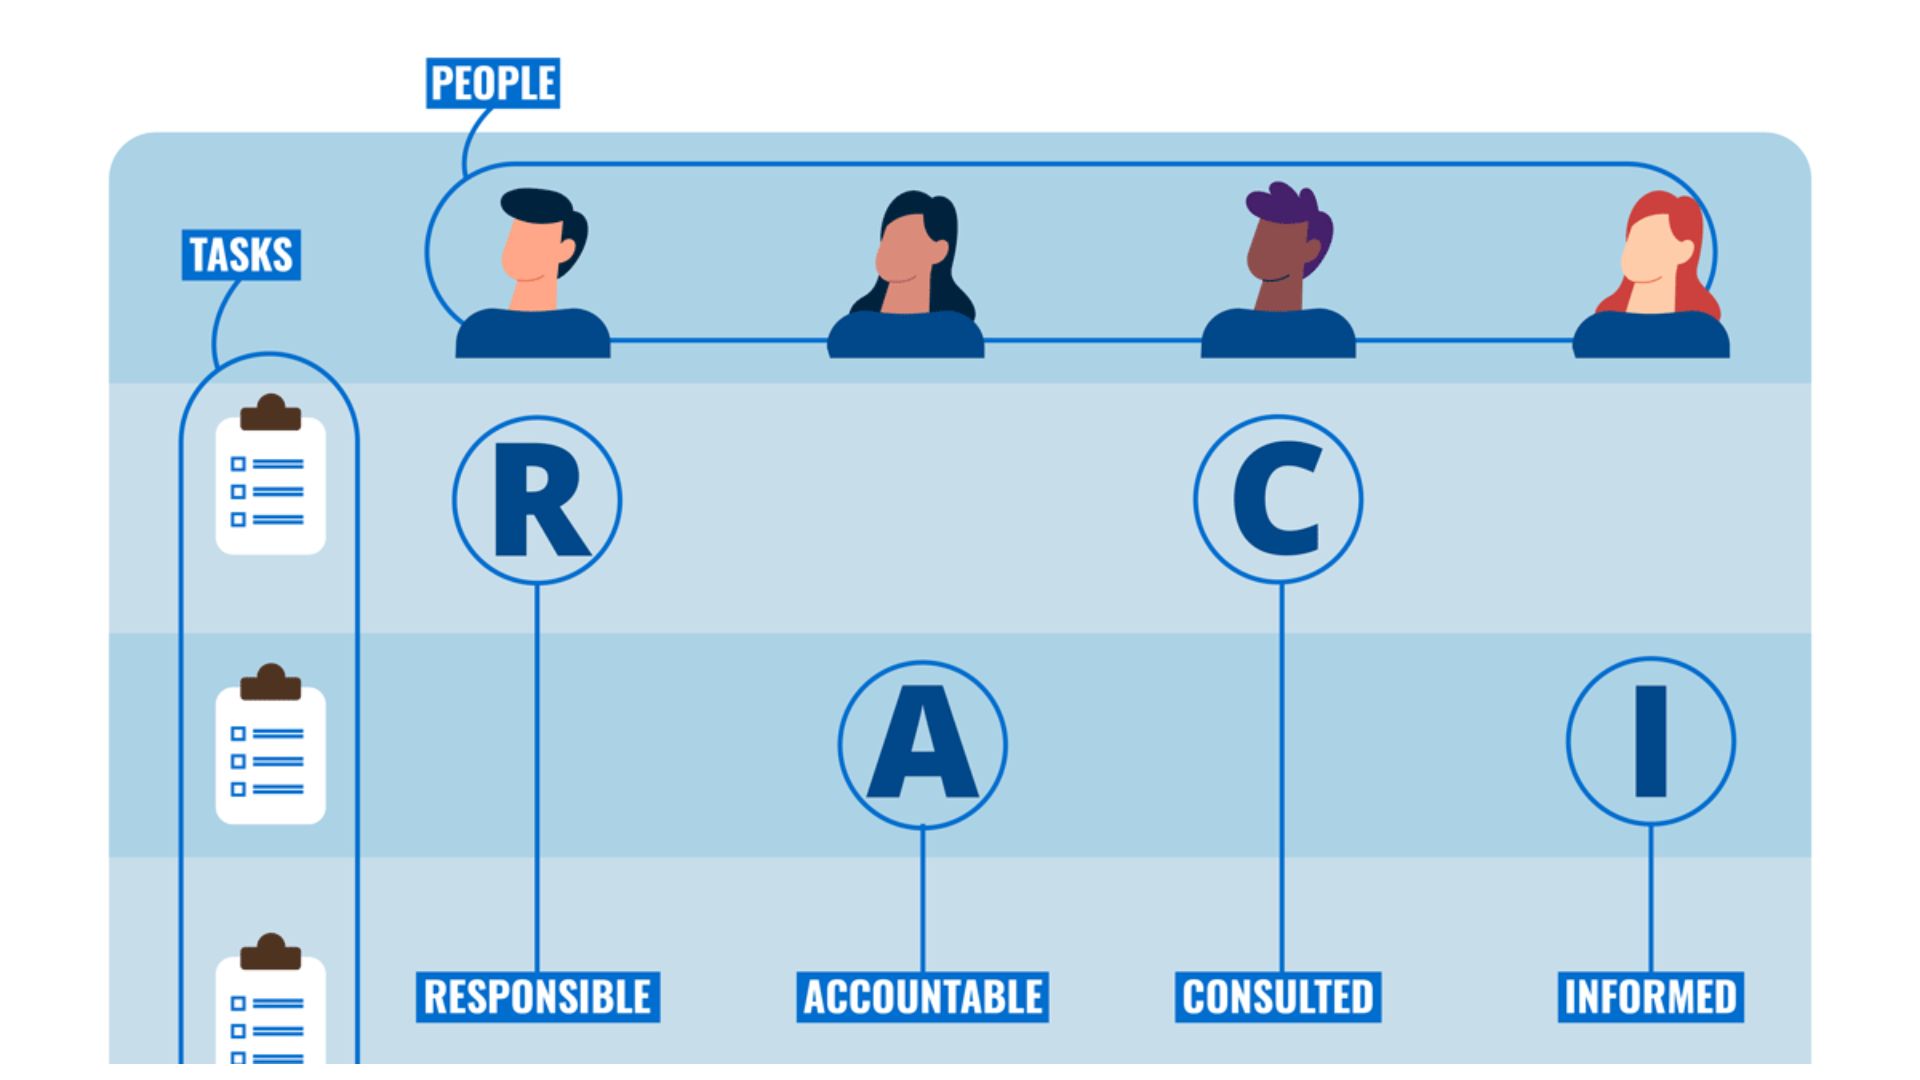
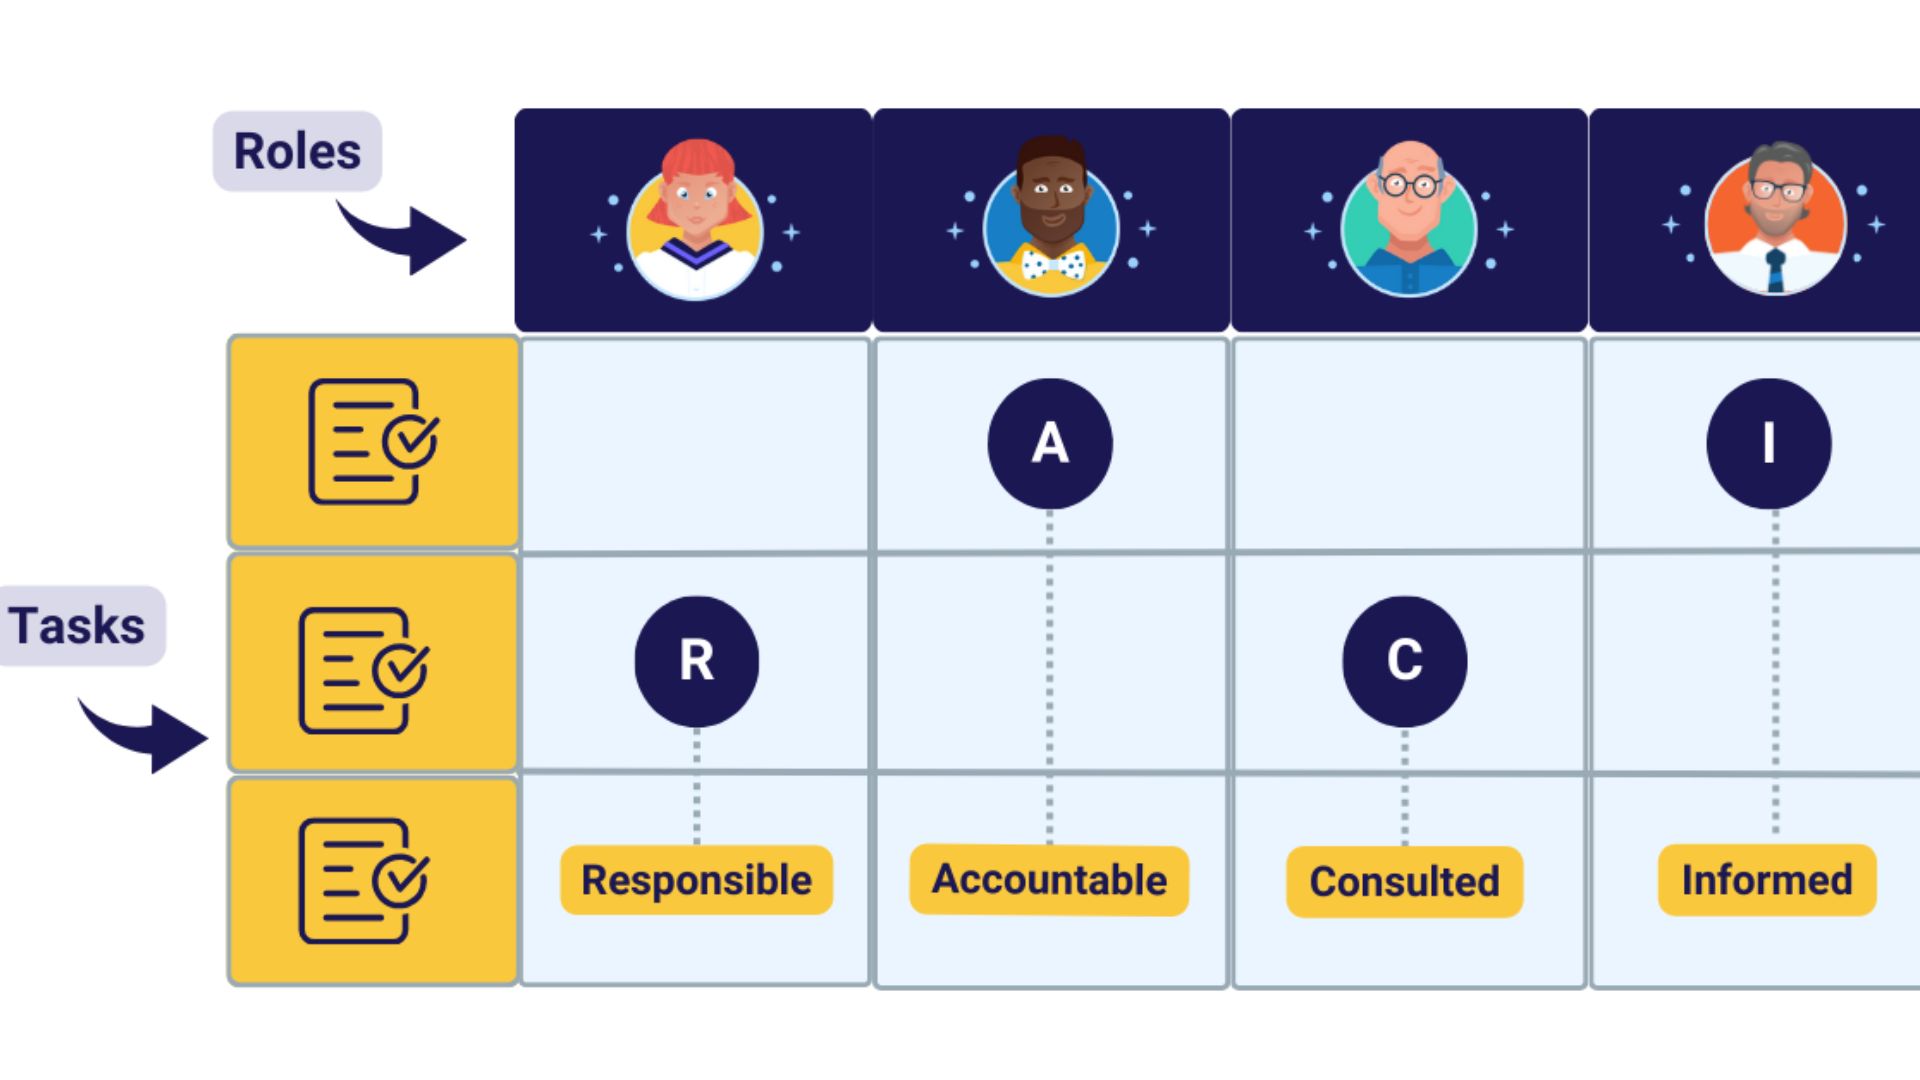
Ever wondered how to untangle the knotted responsibilities within a project team? Or maybe you’ve stumbled upon the terms “Responsible,” “Accountable,” “Consulted,” and “Informed” without the clearest understanding of what exactly they mean. A RACI Chart unfolds as a magic key, the acronym standing for the aforementioned terms, which are the core roles within any project. It’s a visual way to delegate duties, create clarity, and mitigate misunderstandings within a team. Essentially, it’s a project management tool aimed to streamline workspace coordination.
- Responsible: These are the doers, the individuals, or teams who execute the task. For instance, in a software development project, a programmer may be responsible for writing code.
- Accountable: This is the person who makes the final decision and bears the outcomes’ consequences. This is often a single person, like a project manager, who holds ultimate authority.
- Consulted: These are the people who are asked for opinions and feedback before a task or decision. For example, an in-house legal team may be consulted before finalizing a vendor contract.
- Informed: Lastly, these are individuals who are kept in the loop regarding decisions and actions. They may not actively participate, yet they’re crucial to communication lines. Information may flow to them, but not necessarily from them. For instance, a department head might receive updates about a project’s progress.
This quadruple factor synergy ensures productivity, effective communication, and project delivery efficiency. Ergo, the RACI chart roles become indispensable elements to project management success.
Benefits of Using a RACI Chart
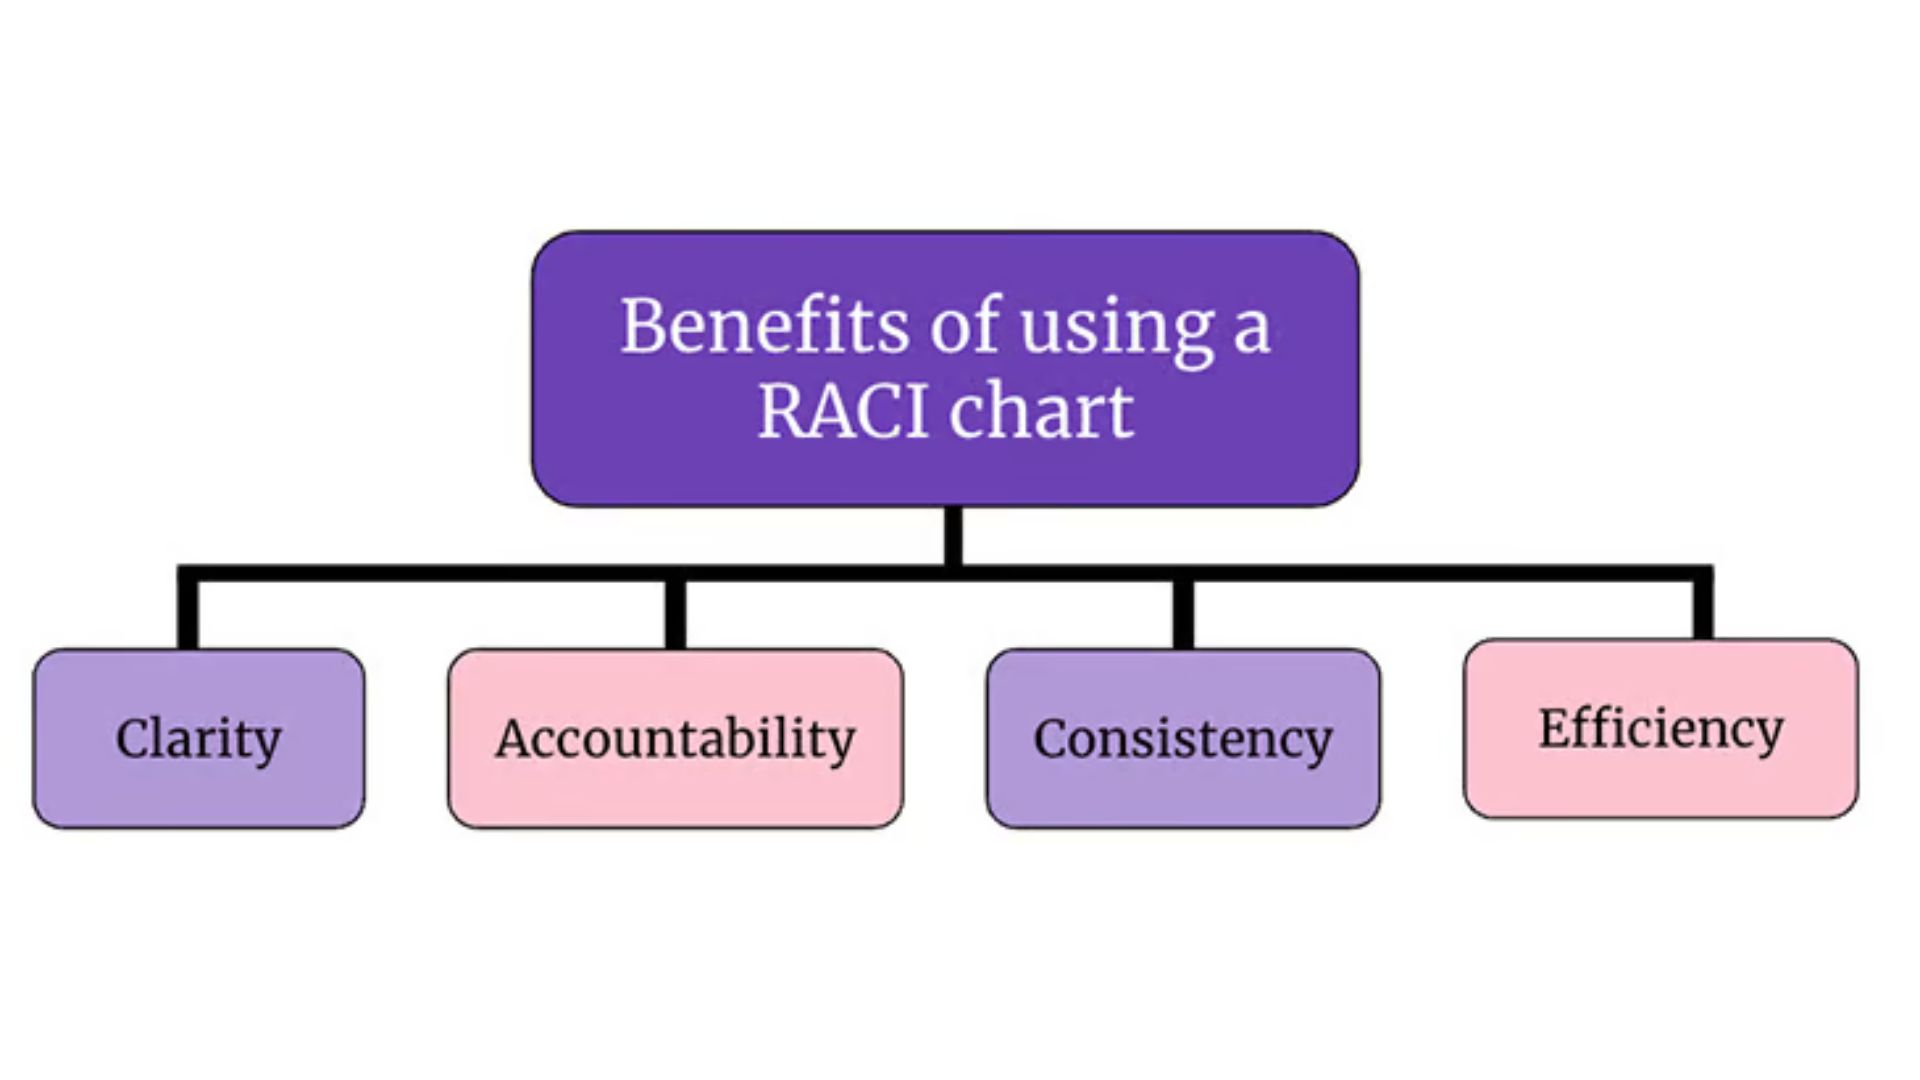
The RACI chart, with its straightforward structure and well-defined components, offers a multitude of benefits in project management. These benefits largely revolve around three key areas: Clarifying Roles And Responsibilities, Enhancing Team Communication, and Streamlining Decision-Making Processes.
Clarifying Roles and Responsibilities
In project execution, clarity in roles and responsibilities eliminates ambiguity. A well-structured RACI chart spells out who is Responsible, who is Accountable, who is Consulted, and who is Informed for every task in a project. For instance, a marketing project can have a team member as the Responsible for creating a campaign strategy, a supervisor is Accountable for the project’s success, colleagues from different departments like finance and creative Consulted for their input, and stakeholders Informed about the project progress. By detailing these roles, a RACI chart assuages confusion, prevents overlap in responsibilities, and ensures cybernetic confluence in team dynamics.
Enhancing Team Communication
A RACI chart paves the way for effective communication within project teams. By specifying who needs to be Consulted or Informed at different stages, the chart minimizes the likelihood of miscommunication or information gaps. Let’s take a software development project as an example – a developer (Responsible) might need to liaise with an analyst (Consulted) about application requirements and notify a team lead (Informed) about the completion of coding tasks. The RACI chart makes these communication lines clear, leading to a coordinated information flow and team harmony.
Streamlining Decision-Making Processes
A RACI chart makes decision-making smoother, particularly under pressure. By identifying who is Accountable, the chart provides clear signposts about the decision chain in a project. In a manufacturing process, for instance, a quality checker (Accountable) decides whether the production batch meets required standards. This clarity in decision-making roles, as defined by the RACI chart, reduces delays, prevents conflicting decisions, and ensures a systemized approach to problem-solving.
Utilizing a RACI Chart offers an array of benefits that can significantly enhance project outcomes. By ensuring role clarity, facilitating communication, and streamlining decision-making, this chart becomes a crucial tool for successful project management.
When to Use a RACI Chart
In the realm of project management, RACI charts possess immense relevance. Their utility isn’t limited to a single, specific instance, but rather, they’re valuable in various scenarios and contexts for enhancing operations—and here are a few examples.
Project Management Scenarios
Under this umbrella, I’d classify any situation where tasks need delegation, responsibilities need clarity, and manpower requires coordination. In managing, say, a software development project, a RACI chart makes it easier to understand who’s developing code, who’s reviewing it, and who’s ultimately liable for the end result. By providing this kind of clarity, the chart assists in preventing misunderstandings that could delay the project, thus saving time, energy, and resources.
Organizational Restructuring
A RACI chart becomes a pivotal tool during organizational restructuring—a phase that often creates confusion. It might be unclear who’s now accountable for what, or who needs consulting on various decisions. Employing a RACI chart during restructuring aids in clarifying these new delineations of responsibility. For instance, if a company decides to merge certain departments, a RACI chart can clearly outline who’s in charge of the merged unit, who’s involved in implementations, and who’s to be updated about progress.
Process Improvement Initiatives
Process improvement initiatives, like Lean and Six Sigma, intend to minimize waste and maximize efficiency. Questions often arise, such as: Who’s responsible for identifying wasteful activities? Who takes accountability for implementing changes? Or, who needs to know about these changes? Here, by formalizing roles and responsibilities, a RACI chart enables smoother execution of process improvement initiatives, reducing the potential for conflict and confusion. So, if a manufacturing firm initiates a Lean project, a RACI chart can help streamline roles—like who measures performance or who implements process adjustments, thus expediting the entire initiative.
How to Create a RACI Chart
Building an effective RACI chart involves a few simple steps: identifying tasks and activities, assigning RACI categories, and crafting an effective design. Stick with me as we break down each step.
Identifying Tasks and Activities
The first step in creating a RACI chart is identifying tasks and activities of the process or project. Each task contributes to the completion of the project. The tasks must be detailed, clear, and specific to allow for proper assignment of roles. For instance, if we have a software development project, tasks might include the gathering of requirements, writing the code, testing it, and migrating it to the live environment.
Assigning the RACI Categories
After all tasks are outlined, the next step is assigning the RACI categories to each task. Each person involved in the project gets assigned one of four roles: Responsible, Accountable, Consulted, or Informed. Take, for example, the task of writing code for the above-mentioned software development project. A software developer may be Responsible for writing the code, a project manager might be Accountable for the task’s completion, a business analyst could be Consulted for input, while the rest of the team is kept Informed about progress.
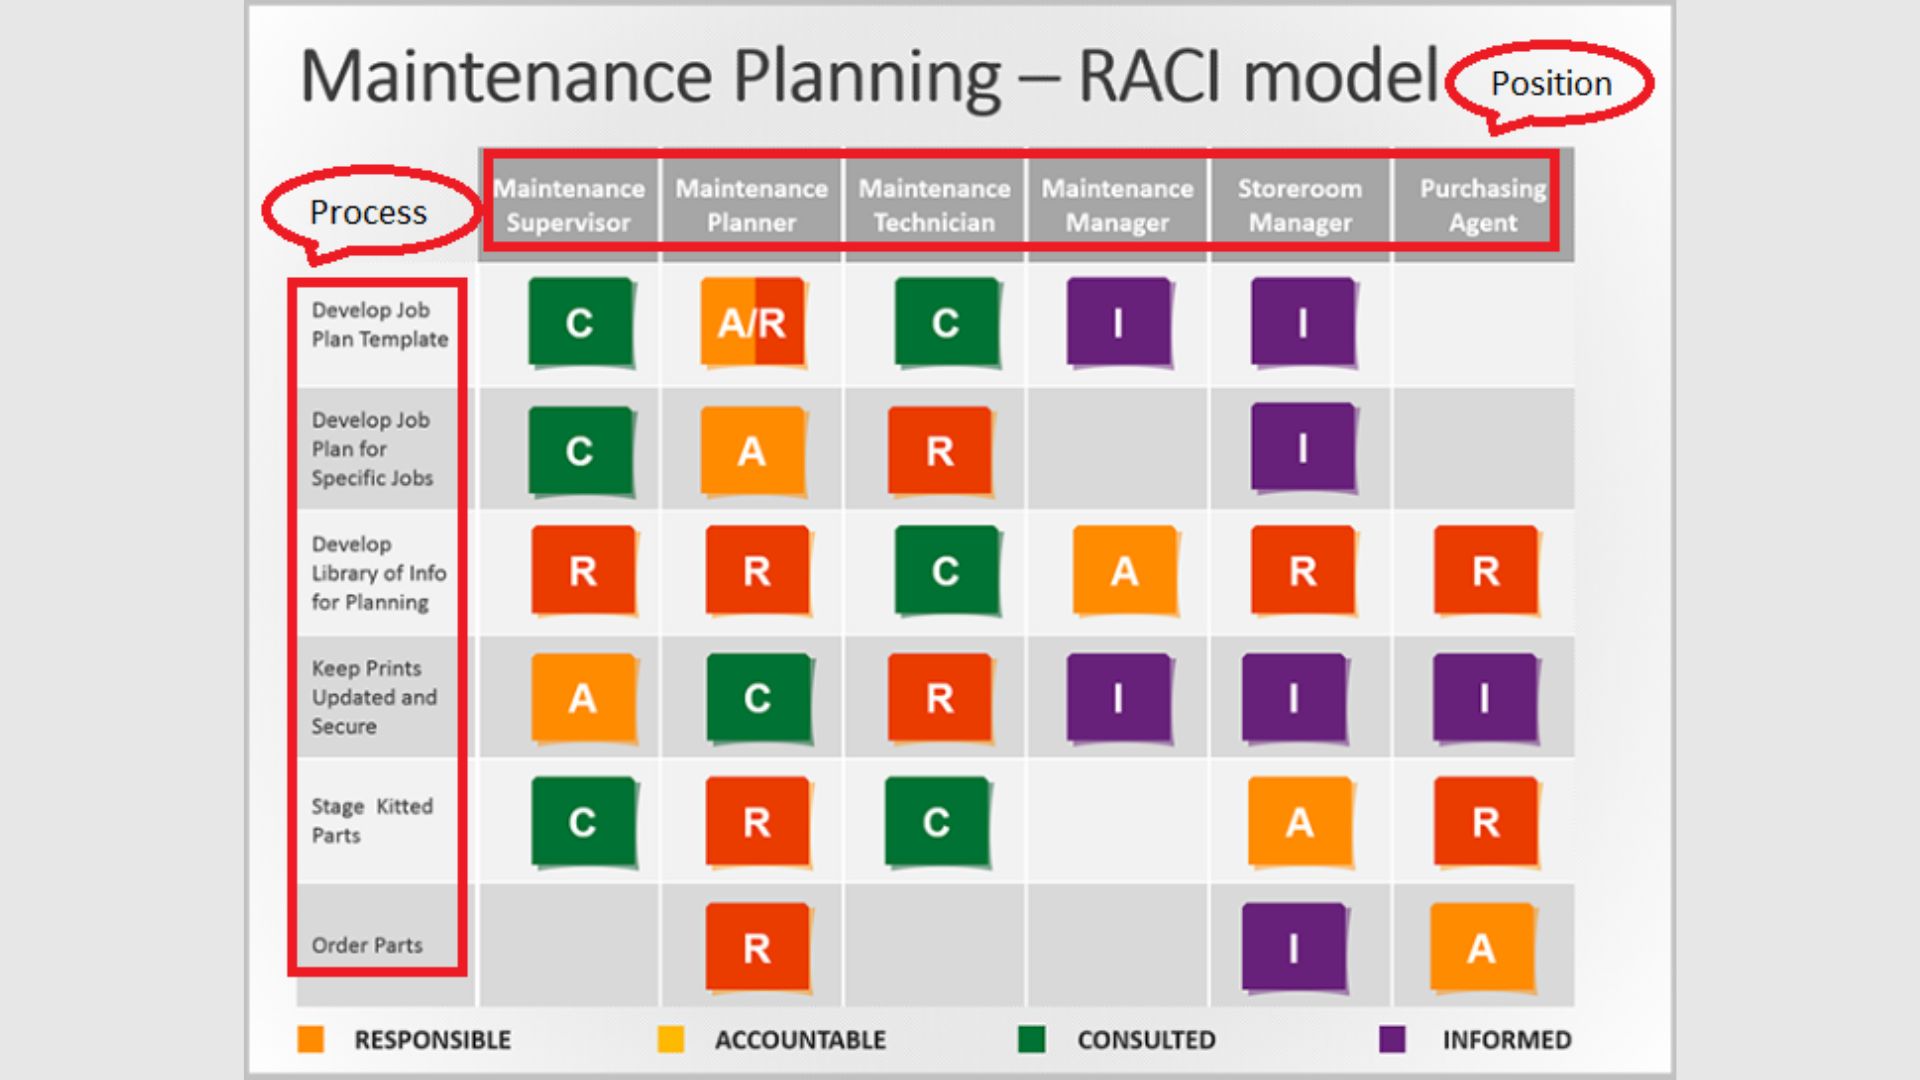
Tips for Effective Chart Design
Finally, having identified tasks and assigned roles, it’s time to design the chart. Keeping it clear and easy to read is paramount. Use a table format, with tasks along one axis and team members along the other. Assign a single letter (R, A, C, or I) to indicate each person’s role in each task. For clarity, you may want to use color-coding. For example, use green for Responsible, blue for Accountable, yellow for Consulted, and red for Informed. This helps users quickly identify their roles in each task. Also, remember to review and update the chart regularly, as roles and tasks may change over the course of the project.
Creating a RACI chart may seem tedious initially, but it’s an invaluable tool for efficient project management. Remember, the key lies in clarity – from identifying tasks to designating roles and designing the chart. With a well-crafted RACI chart, managing projects becomes a smoother, more transparent process.
Best Practices for Implementing a RACI Chart
In the world of project management, the implementation of a RACI chart can greatly streamline tasks and clarify roles. However, there are some best practices to bear in mind to achieve optimal results.
Securing Buy-In from Stakeholders
First, stakeholders’ buy-in is paramount to the success of a RACI chart. I find that it’s important to engage all team members explicitly and ensure they understand their specific roles and responsibilities. Open-ended conversations allow stakeholders to voice concerns if they feel burdened or unclear about their assigned tasks. An example of this is having routine meetings where roles and responsibilities are clarified and doubts and concerns are addressed.
Regular Review and Updates
Maintaining a RACI chart isn’t a one-time task. It involves regular review and updates, adjusting roles and responsibilities per the evolving project needs. For instance, if the timeline of a project is extended, tasks might need to be reassigned to different team members to ensure project progression. Punctual, systematic revisions keep the team aligned, engaged and contribute to the overall project success.
Integrating with Other Project Management Tools
Finally, one underrated but essential practice is integrating the RACI chart with other project management tools. Project management software, such as Microsoft Project or Trello, effectively allows you to embed the RACI chart in the project management process itself. This integration provides real-time visibility of task ownership, clear accountability, and avoids miscommunication. As a case in point, Trello’s boards and cards can mirror a RACI chart, where cards reflect tasks, and members assigned to those cards reflect the roles in the RACI matrix.
In sum, the successful implementation of a RACI chart relies not only on its creation but also how effectively it’s maintained, integrated and understood by all team members. This involvement enhances team coordination, role clarity, and ultimately, project success. These practices reaffirm the primary objective of a RACI chart, which is to ensure clarity in task allocation and team roles.
Exploring RACI Chart Template
My journey into the world of RACI chart templates unveils a trove of resources suitable for a broad range of industries. I’ll help you demystify these templates and reveal how to employ powerful tools and software to customize them to your needs.
Templates for Various Industries
As we delve deeper, it becomes evident that RACI chart templates abound for diverse sectors. Sectors ranging from healthcare, manufacturing, IT, and education find immense value in these tailored templates. For instance, IT industry examples often focus on project development, detailing crucial roles like project managers, system analysts, and developers.
Customizing Templates for Your Needs
Personalizing these templates isn’t as daunting as it may seem. For starters, identify the specific tasks and activities relevant to your project. Subsequently, determine the roles involved and assign them accordingly using the Responsibility, Accountability, Consultation, and Inform information within the chart. Just remember to keep it simple, precise, and focused on your project goals.
Tools and Software for RACI Chart Creation
Incorporating digital tools and software is a game-changer when it comes to creating RACI charts. Trello, Smartsheet, and Microsoft Office Suite offer features such as pre-built templates, drag-and-drop editing, and collaboration tools, making the chart creation process straightforward and intuitive.
Conclusion
So there you have it. RACI charts are a game-changer in project management, bridging the gap in task delegation and team coordination. By following the practical steps I’ve outlined, you can create your own chart and see how it transforms your team’s efficiency. Remember, it’s not just about creating a chart, but also about getting everyone on board, reviewing it regularly, and integrating it with your other project management tools. And don’t forget the power of templates. They’re versatile and adaptable to any industry, be it healthcare, manufacturing, IT, or education. With tools like Trello, Smartsheet, and Microsoft Office Suite, you can customize them to your project’s needs. I’m confident that with a well-constructed RACI chart, your project management will never be the same.
Frequently Asked Question (FAQs)
What is a RACI chart?
A RACI Chart, or Responsibility Assignment Matrix, is a project management tool designed to clarify roles and responsibilities within tasks and processes, ensuring efficient delegation, effective team coordination, and task completion.
How is a RACI chart used in project management?
RACI charts are used in project management to provide a clear roadmap of who is doing what in a project. They eliminate confusion on roles and responsibilities, leading to efficient task completion and success in project outcomes.
What initial steps are taken to create a RACI chart?
Creating a RACI Chart begins with identifying all the tasks within the project, followed by assigning the appropriate roles to each, which usually include Responsible, Accountable, Consulted, and Informed positions.
What best practices exist for implementing a RACI chart?
Implementing a RACI chart effectively demands stakeholder buy-in, regular review of the chart, and integration with other project management tools to maximize team coordination and project success.
Why are RACI chart templates useful and how do they vary across industries?
RACI chart templates are useful as they serve as a simplified, flexible starting point in creating a new chart. They can be customized based on project-specific tasks and roles, and are versatile to fit various industries like healthcare, manufacturing, IT, and education.
Which tools can help create and customize RACI charts?
Tools like Trello, Smartsheet, and Microsoft Office Suite are useful in creating and customizing RACI charts, aiding the process from task identification to role assignment, thus ensuring efficient creation of the chart.
Leave a Reply