Top 10 Reporting Software for Better Project Visibility
In the fast-paced world of management, you’re tasked with many responsibilities. One of those is keeping a pulse on your team’s performance. But let’s face it: you don’t have the luxury of time to create detailed reports from multiple data sources manually. That’s where top-notch reporting software comes in.
These tools are designed to take the heavy lifting off your shoulders. They blend project management with interactive reports, presenting simple data visualizations that succinctly communicate your team’s effectiveness. So, buckle up as we explore top 10 reporting software and help you find the perfect fit for your business..
What is Reporting Software?

Reporting software helps you streamline data processing, making sense of big data, and presenting it in an understandable format. At its core, a reporting software tool serves as a central hub for data. It pulls in data from various sources, processes it, and delivers comprehensive reports. These reports can convey essential insights about your business operations. They visually represent complex data sets, giving you a brief snapshot of the performance metrics that matter the most to you.
Some of these tools, branded as free reporting software, are even free. They provide the basic functionalities you need to manage your data, making them ideal choices for small—to medium-sized companies with budget constraints. However, don’t let the term “free” mislead you. They might require specific technical skills to use effectively. This is where premium upgrades come into play. High-end software often comes with advanced features and user-friendly interfaces, making processing and interpreting data easier.
Features to Look for in the Best Reporting Software

When it comes to managing a data-rich business environment, selecting an optimal reporting software tool is crucial. Key features to look for include embedded analytics, predictive or prescriptive analytics, natural language querying, APIs and data connectors, visualizations, automated reporting, notifications and alerts. Here is a breakdown of why these features stand out and why you might want to consider them when choosing the best reporting software.
Implanted Analytics
When you use a tool like Tableau, you’re getting top-notch embedded analytics. Imagine being able to insert data collection and reporting functionality directly into your existing workflow—the convenience, the time you’d save. A dynamic tool that uses a drag and drop method to create reports is ideal for quickly building powerful dashboards. Your aim should be a reporting tool that enhances your workflow, not complicates it.
Predictive or Prescriptive Analytics
Prescriptive or predictive analytics tools remove the human bias from predictions. With IBM’s Cognos, you can use AI or machine learning algorithms to develop models that predict potential outcomes based on market and human factors that you establish. Such tools can be a game-changer in understanding the elements that engender potential growth or contraction, enabling highly complex decision-making.
Natural Language Querying
The best reporting software tools, such as Joiin, harness the power of AI, ML and NLP technologies. Some even come with AI and ML-powered intelligent assistants that comprehend queries asked in natural language. The use of natural language querying in your software tool can significantly streamline your data processing tasks.
APIs and Data Connectors
With APIs and data connectors, integration with other business apps becomes a breeze. For instance, Tableau integrates with a variety of business tools like Google Cloud, Microsoft SQL Server, Google Sheets, Hive, and SAP. Look for a reporting software tool equipped with APIs and data connectors to enable seamless integration.
Visualizations
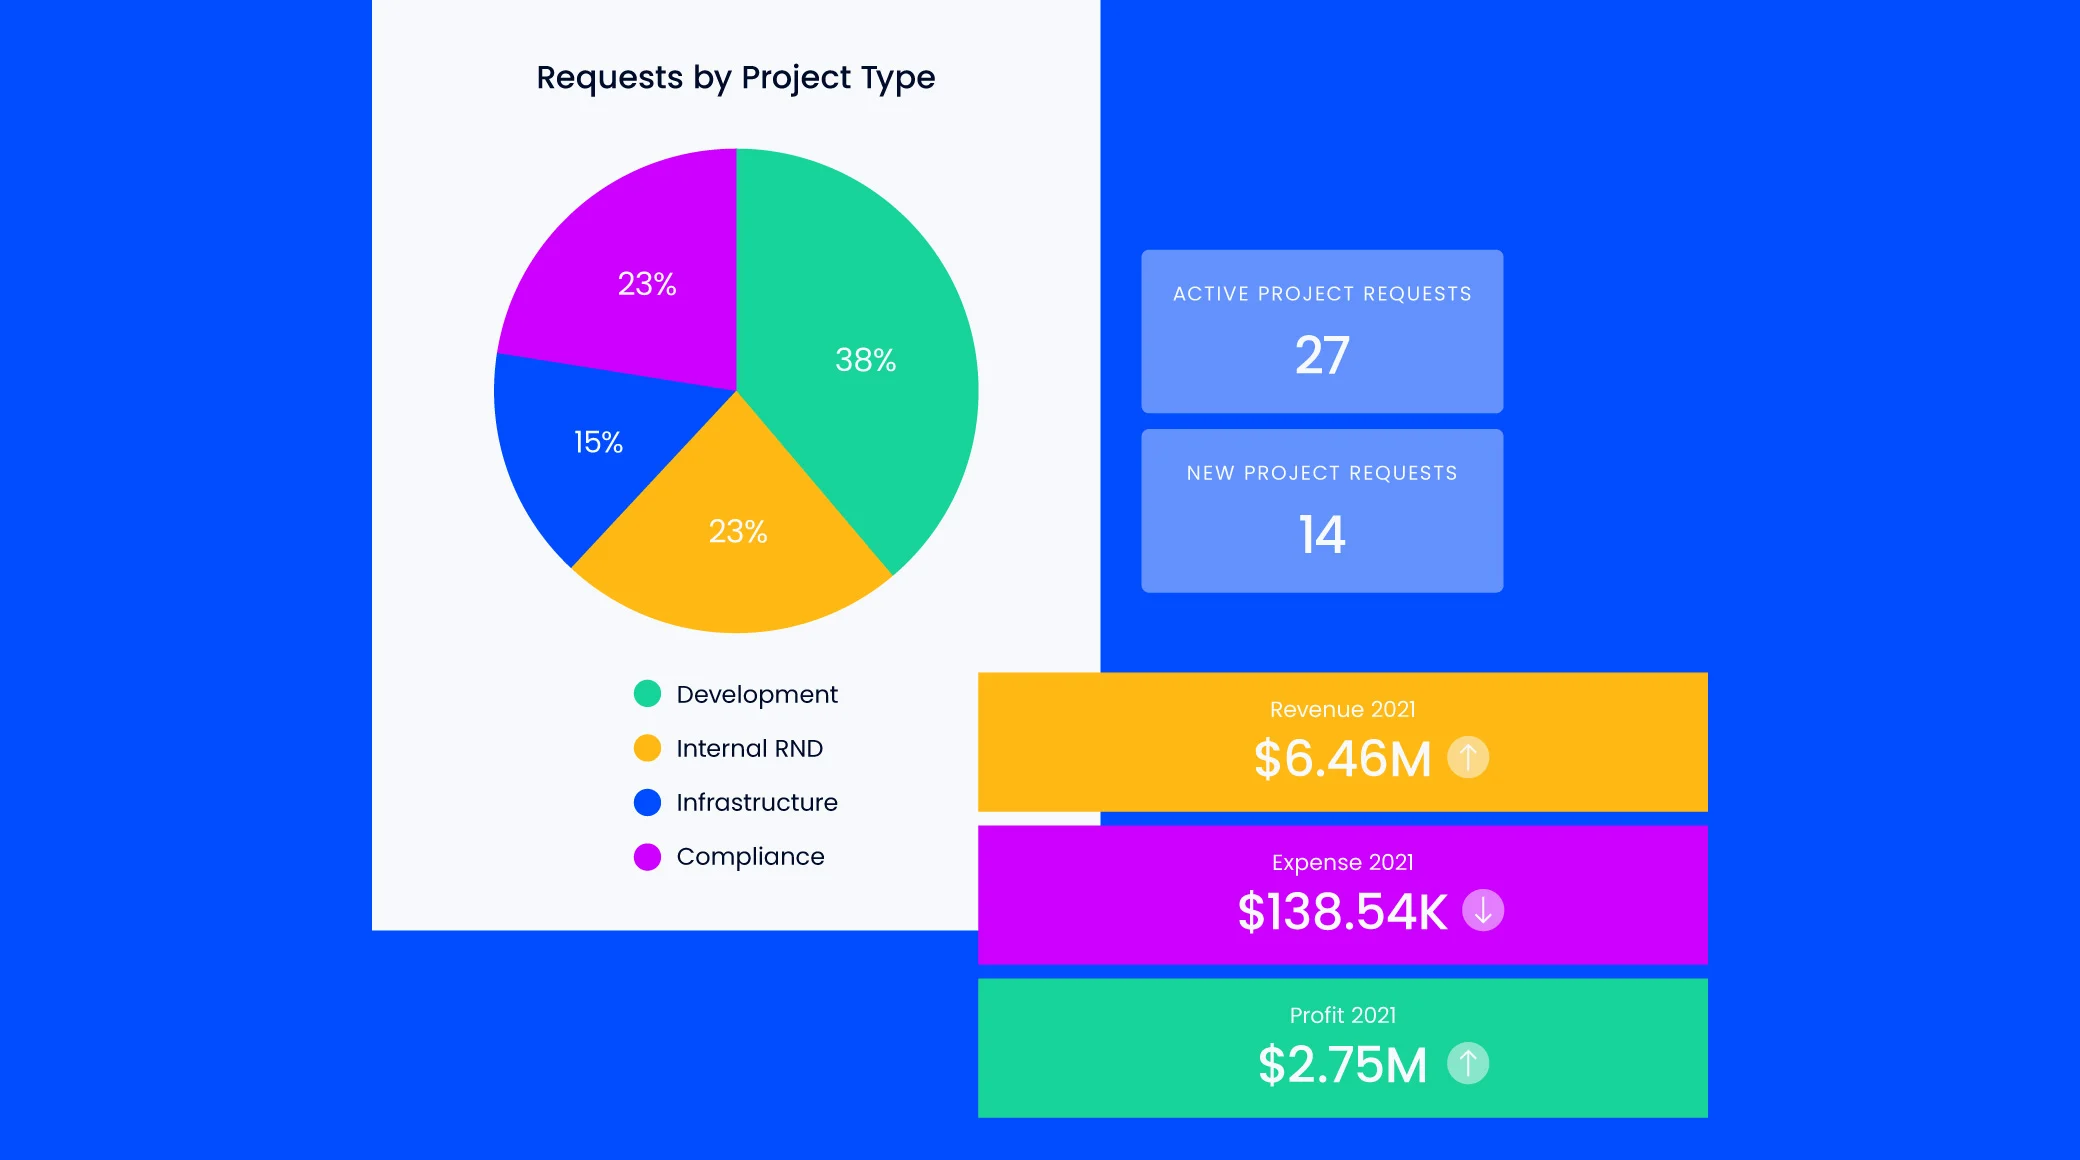
To facilitate comprehension of complex data, tools featuring a wide variety of visualization options are pivotal. Graphs, charts, pivot tables, summary views, KPI widgets, and custom-themed dashboards can make a world of difference in reports. The goal here is to make data more understandable, useful, and visually appealing.
Automated Reporting
Another critical feature you should be after in reporting software tools is automated reporting. With automated reporting, you’ll have tools that automatically collect and report data on all projects and team members. This feature will save you time and resources on manual data collection and reporting.
Notifications and Alerts
The best software reporting tools offer smart data alerts and forecasting features to aid you in your daily decision-making tasks. Notifications and alerts allow for immediate action when necessary, enhancing efficiency and responsiveness.
What are the Types of Reporting Tools?

Deciding on the right reporting tools for your company’s needs can be an arduous task. Not to worry; this section will delve into the core types of reporting software and elucidate how these diverse tools can be pivotal in tracking and improving your enterprise’s performance across various verticals.
1. Business Intelligence (BI) Software
Business intelligence (BI) software connects varied facets of reporting and database data spanning across your entire firm. They come in handy when you need to merge, compare, and visualize data from disparate departments, shedding light on intricate data sets that could otherwise go unnoticed.
BI software isn’t closely tied to any particular business size or industry, making it an excellent option for businesses of all kinds. There are even free reporting software options for business intelligence that you might wish to consider if you’re beginning your BI journey. The crux here is the ability to create quick, customized reports with ready-made filters, save such reports for future use, and export them as Excel XLS or CSV files for external sharing.
2. Corporate Performance Management (CPM) Software
A subset of both reporting and BI software, Corporate performance management (CPM) software is designed to aid firms in defining their KPIs of growth and success—including financial reporting. It shows performance towards these goals by allowing connections to all business-critical data sets from various systems like accounting software, CRM software, marketing software, supply chain software, ERP software, and other reporting tools.
While reporting software tools for CPM perform similar functions as BI software, they are uniquely equipped to handle financial reporting. Therefore, they are the go-to options for companies focusing on financial growth metrics and KPIs.
3. Marketing Reporting Software
Marketing reporting software tools can be a game-changer for businesses that primarily revolve around marketing data. They aggregate marketing data from various sources, including databases, files, social media, CRM/ERP, and help desks, providing robust marketing intelligence reporting.
Platforms like these offer a contextual basis for interpreting your data by combining data sets from a variety of diverse systems. This makes your data more readable, useful, and presentable, enabling you to make smoother, more informed marketing decisions.
4. Information Technology (IT) Reporting Software
On that note, it’s undeniable that information technology (IT) drives today’s business landscape. Therefore, employing IT reporting software tools to keep tabs on various technological aspects—from applications and systems management to understanding user behavior—can ensure that your IT landscape remains healthy and evolves in line with business needs.
IT reporting software can often be found within broader software suites, offering additional components such as application performance reporting, enterprise reporting, self-service reporting, and visualization and reporting. The availability of such diverse reporting types facilitates thin-slice data analysis, aiding IT managers in making data-driven decisions and strategies.
10 Reporting Softwares for Businesses

Choosing the right reporting software can significantly improve your team’s efficiency. It allows you to pull together data from various sources and create robust, interactive dashboards. Here, we’ve compiled a list of ten effective reporting tools software you can put into action.
1. Hive
Hive is a project management reporting tool that gathers data from various sources in one place. It’s a cloud-based software allowing you to get an overview of all your business operations. With Hive, you can create interactive dashboards that track real-time data. And on any internet-equipped device, your reports will always be just a few clicks away.
2. Octoboard
Octoboard blends project management with interactive reports and user-friendly data visualizations. Its strength lies in pulling in data from different departments, offering a comprehensive snapshot of your business’s performance.
3. Power BI
Power BI, a business intelligence tool from Microsoft, makes it easy for you to create interactive reports. It fetches data from a wide range of sources, ensuring holistic views of your operations. If you seek a tool that can translate complex data into easy-to-understand visuals, Power BI might be a home run for you.
4. ProWorkflow
ProWorkflow is suitable for businesses needing a simplified yet comprehensive view of ongoing projects. If you’ve got a large team and multiple simultaneous projects, ProWorkflow can help you manage and visualize your operations seamlessly.
5. Reportei
If your business revolves around digital marketing, Reportei might be the punch you need. This tool churns out reports that merge vital marketing data, assuring informed and timely decisions.
6. Tableau
Tableau is a top-of-the-line reporting software tool when it comes to converting business data into insightful visualizations. It offers compelling reports that users can explore interactively. What’s more, its powerful dashboards are customizable, offering a personalized data experience.
7. ThoughtSpot
Thoughtspot is synonymous with simplifying data analytics. If you want a tool that streamlines complex datasets into useful insights, ThoughtSpot does it with an ace up its sleeve — AI-driven analytics.
8. Whatagraph
Whatagraph takes reporting a notch higher with automated marketing performance reports. It’s like having a 24/7 reporting assistant. You can customize its dashboards to fit your specific needs.
9. Wrike
Wrike is a dynamic project management tool that’s also great at reporting. Its dashboards are easy to understand, and the tool integrates easily with various applications, resulting in efficient and effective reporting.
10. Zoho Analytics
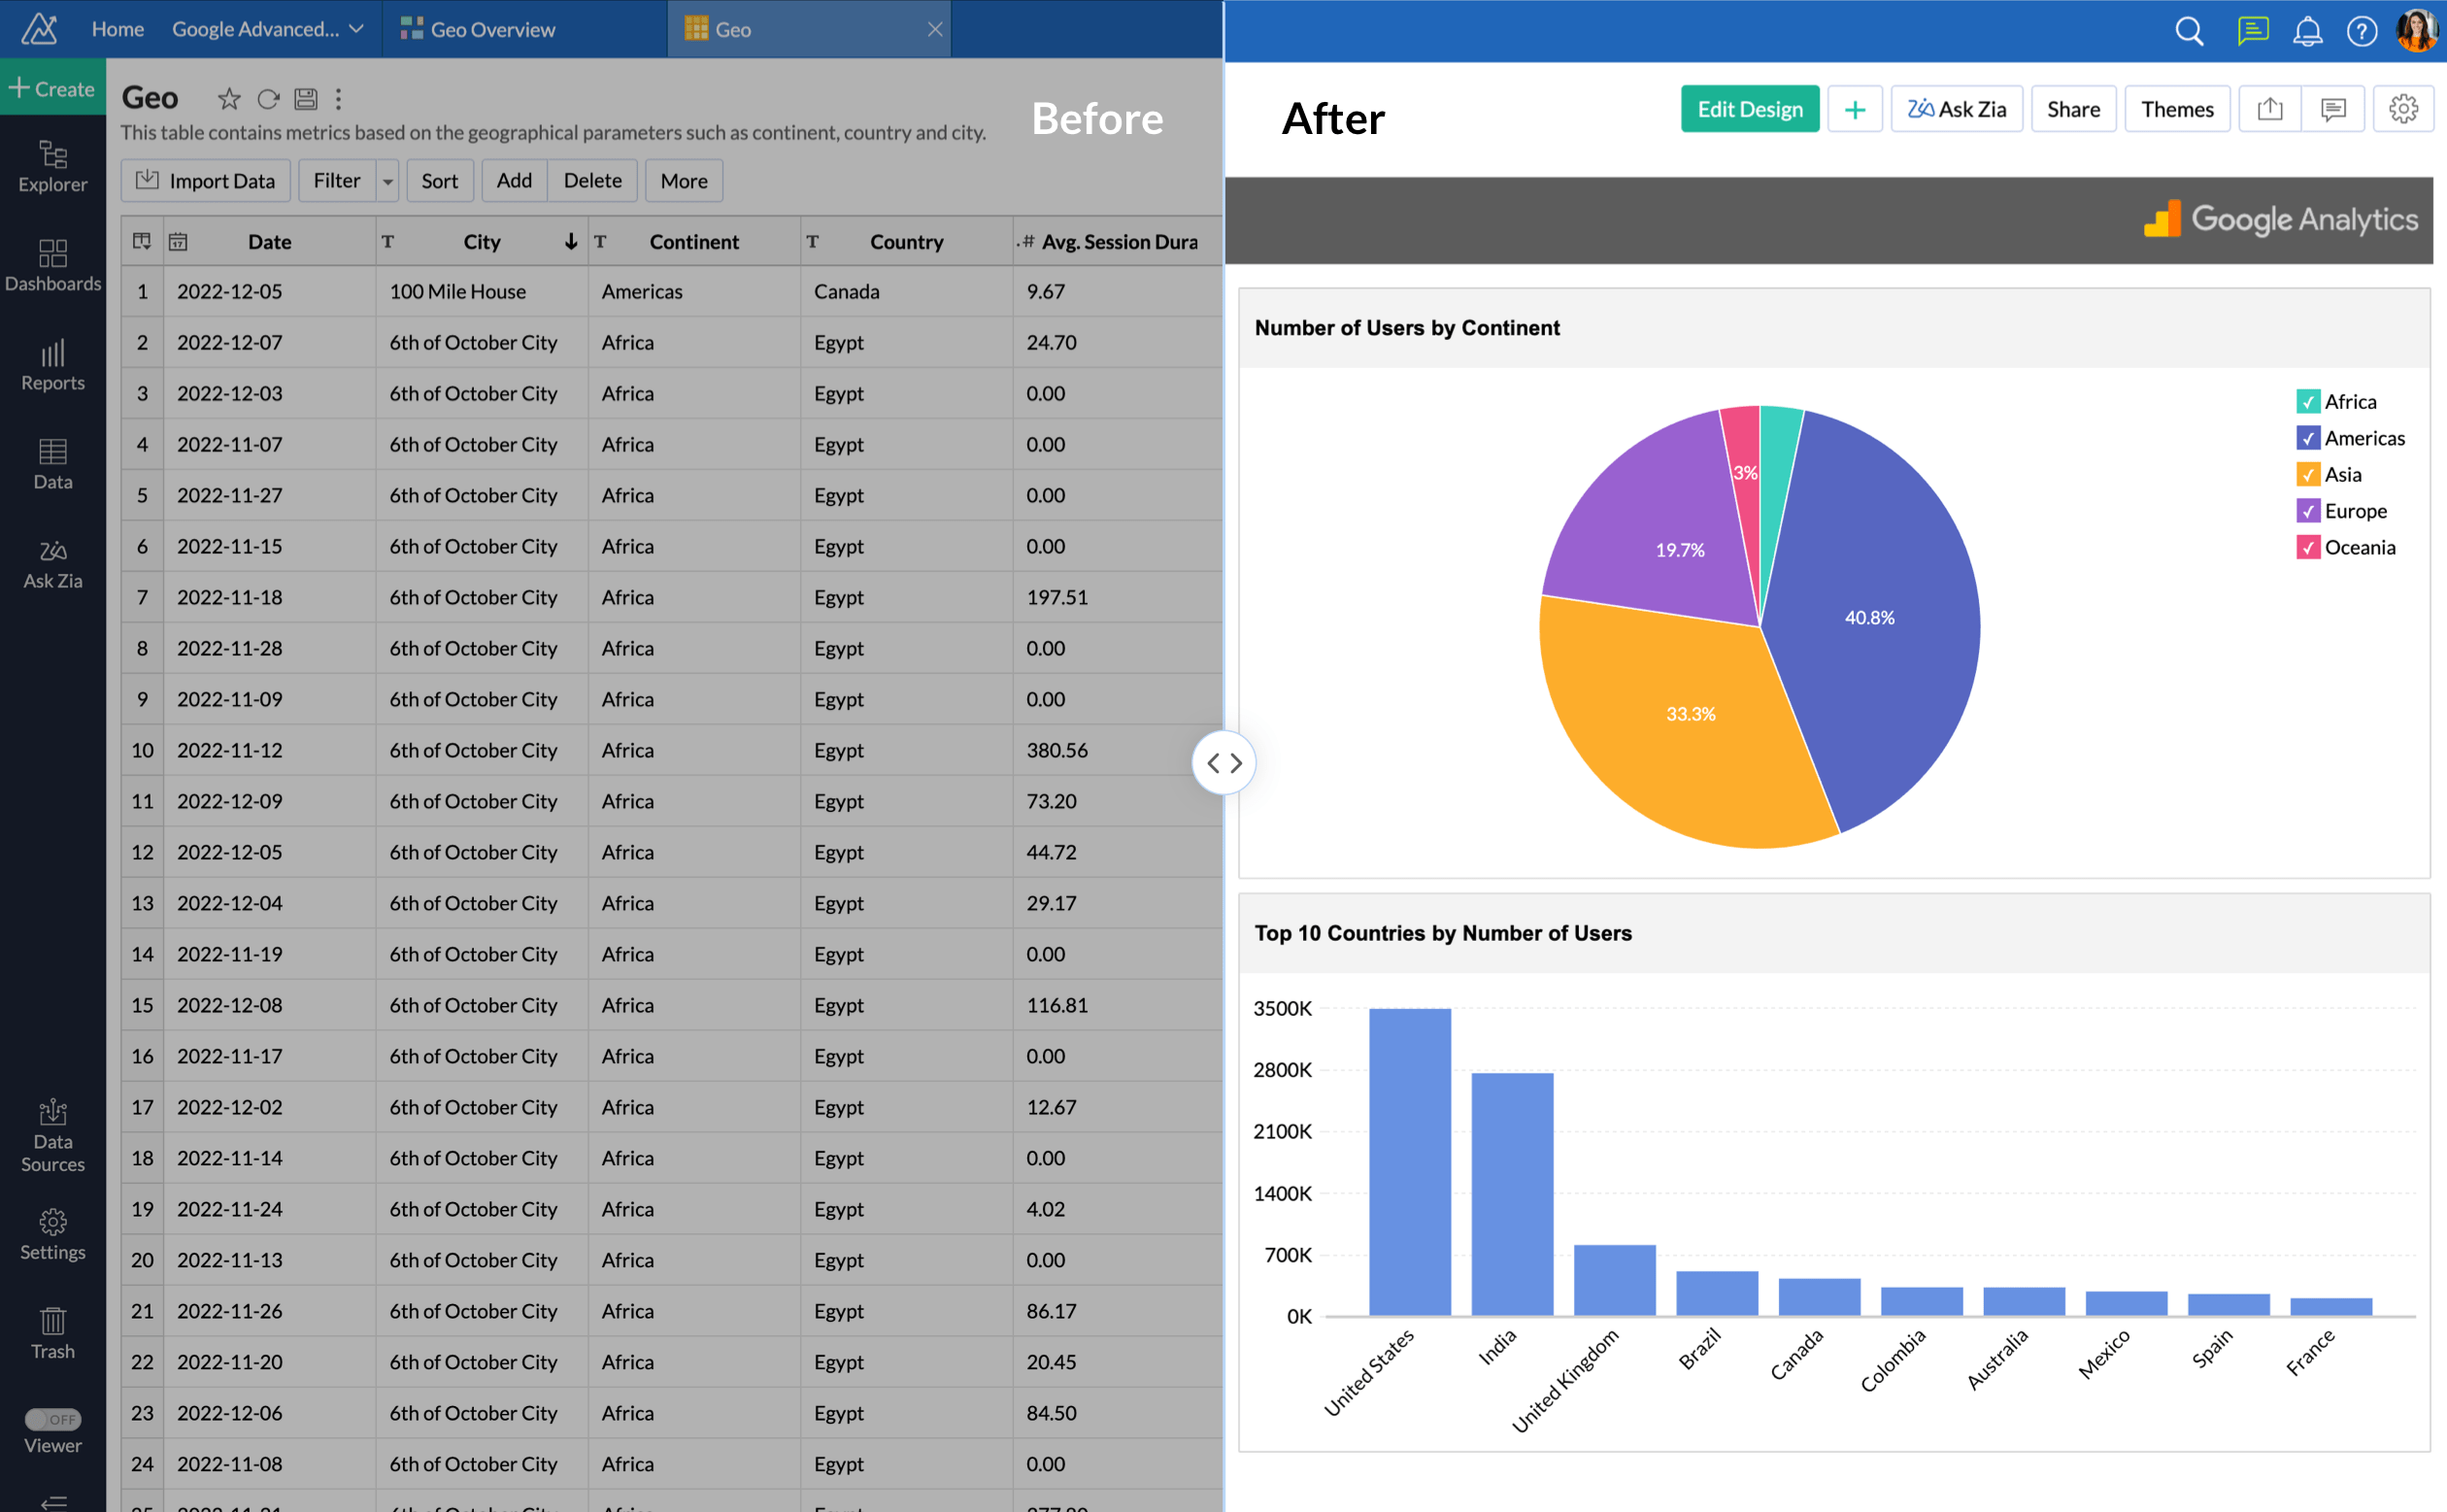
Zoho Analytics is a self-service BI tool that comes in handy when making data-driven decisions. It interfaces well with other business tools, promising smooth and seamless reporting. Keep in mind that all businesses have unique demands; the task lies in picking an option that matches your unique needs. A free reporting software trial is a good starting point when testing the waters.
Conclusion
Choosing the right reporting software can make a difference for your business. It’s not just about data collection but also about understanding and acting on that data. Tools like Hive, Octoboard, and Power BI, among others, offer unique features that cater to different business needs. Remember, it’s about finding the perfect fit for your business. So, test these tools and see which one aligns best with your business goals.
Frequently Asked Questions
Q1. What is a reporting tool?
Reporting tools, also known as software reporting tools, are specific programs designed to report, format, and present data. These tools facilitate understanding by generating visual tables, graphs, and other data visualizations.
Q2. Why should businesses use reporting tools?
Reporting tools make it easier for businesses to track performance and enhance decision-making processes. They provide comprehensive snapshots of different facets of business operations, presenting data in a digestible format.
Q3. What kind of reporting tool should businesses use?
The type of reporting tool required depends largely on the business’s specific needs. Tools like Hive, Octoboard, Power BI, or Zoho Analytics all cater to different requirements. It’s recommended to start with free trials to find the most suitable tool.
Q4. Does Google provide a reporting tool?
Yes, Google provides the Google Analytics reporting tool, which helps visualize data, making it easier to understand and utilize marketing data.
Q5. Which Microsoft tool can create reports?
Microsoft Access features a Report Wizard, a tool that asks a series of questions and creates a report based on the responses. This makes report creation simpler and quicker.
Q6. Is there an app for creating reports?
Yes, tools like InetSoft’s report writer app are designed for report creation. It offers a balance between simplicity and advanced enterprise-level reporting capabilities.
Q7. What is the quickest way to create a report?
The quickest way to generate a report is by using the Blank Report tool. This is especially useful when planning to use only a few fields in your report.
Q8. What is Tableau used for in reporting?
Tableau is a reporting tool known for its insightful visualizations. It’s particularly valued in the field of data analytics for transforming raw data into an easily understandable format. Notably, it’s beneficial for creating interactive reports.

Leave a Reply